

Review reports
This page is for the people who have to answer questions like "how much did we sell today", "which products lose money", and "can I trust this stock number": usually the store manager and the accountant. You will learn what to look at each morning, which question opens which report, and the order to follow when two numbers disagree, instead of guessing.
The numbers here are produced by the other workflows: sales at the POS, receipts through warehouse documents, corrections through stock counts. Reports only read the data; to fix a number, go back to the source document.
Three layers of information
The system answers three levels of question. Keep them apart:
| Layer | Answers | Where |
|---|---|---|
| Dashboard | What needs attention right now | The Dashboard menu |
| Daily Briefing | Today against yesterday and the same day last week | Reports → Daily Briefing |
| Detailed reports | Analysis, reconciliation, exports | The Reports menu |
You only see the report groups your account is allowed to view: sales, inventory, debt, and e-invoice reports each have their own permission, and debt reports also need the Debts module on. If a group is missing, request access as described in Users and security.
Before trusting a number
Three conditions decide whether the numbers mean anything:
- Products have a Cost price. Without it, every profit and margin figure shows 0, not because you sell at a loss but because the system has nothing to subtract.
- The timezone is set correctly under Settings → General Settings. A wrong timezone pushes end-of-day sales into the next day.
- Sample data is deleted once the store runs for real. Sample orders carry the
NWC-SAMPLE-code and count straight into revenue.
On how numbers are counted: every sales report counts only completed Sale orders, dated by completion. Gross sales are the order totals, and net sales are the order totals minus tax. Completed refunds are subtracted, dated by refund time and without tax. The start and end dates follow the store time zone, and the end day is included up to midnight.
Start the morning on the Dashboard
Open the Dashboard. It has two views, Inventory and Sales.
Pick a warehouse with the chips at the top (the default is all warehouses) and a Period: 7D (default), 30D, This month or Last month. "Updated {time}" shows how fresh the data is.
In the Sales view, scan the key figures: net sales, orders, average basket and realized margin. Each is compared with the same number of days just before the period. Click See report on a card to jump to the matching report.
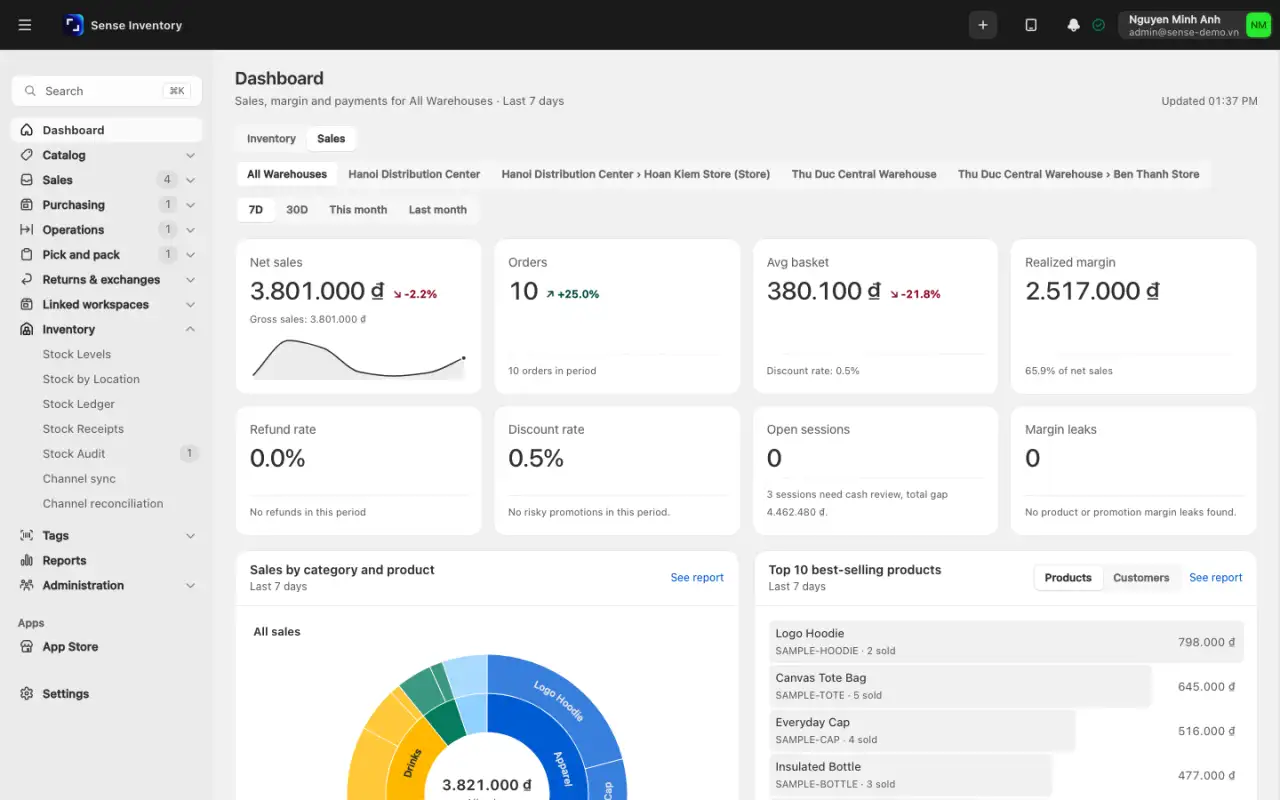
In the Inventory view, check active RFID tags, stock value, items that need restocking and the work queue. A queue row only appears if you have that area's permission, and it only counts your warehouses.
A tile showing 0 with a "no activity" note means the query ran and there really was nothing in that period, not that the screen is broken. A store with no products and no orders yet sees a Getting started card.
Daily Briefing refreshes every 60 seconds and raises five alerts: less than 7 days of stock left, no sale in 30 days, till sessions open for more than 12 hours, till closes with a cash discrepancy in the last 24 hours, and a refund rate today that is more than double the 7-day rate.
Which question opens which report
The right column names the card on the Reports page, followed by the tab inside it where there is one:
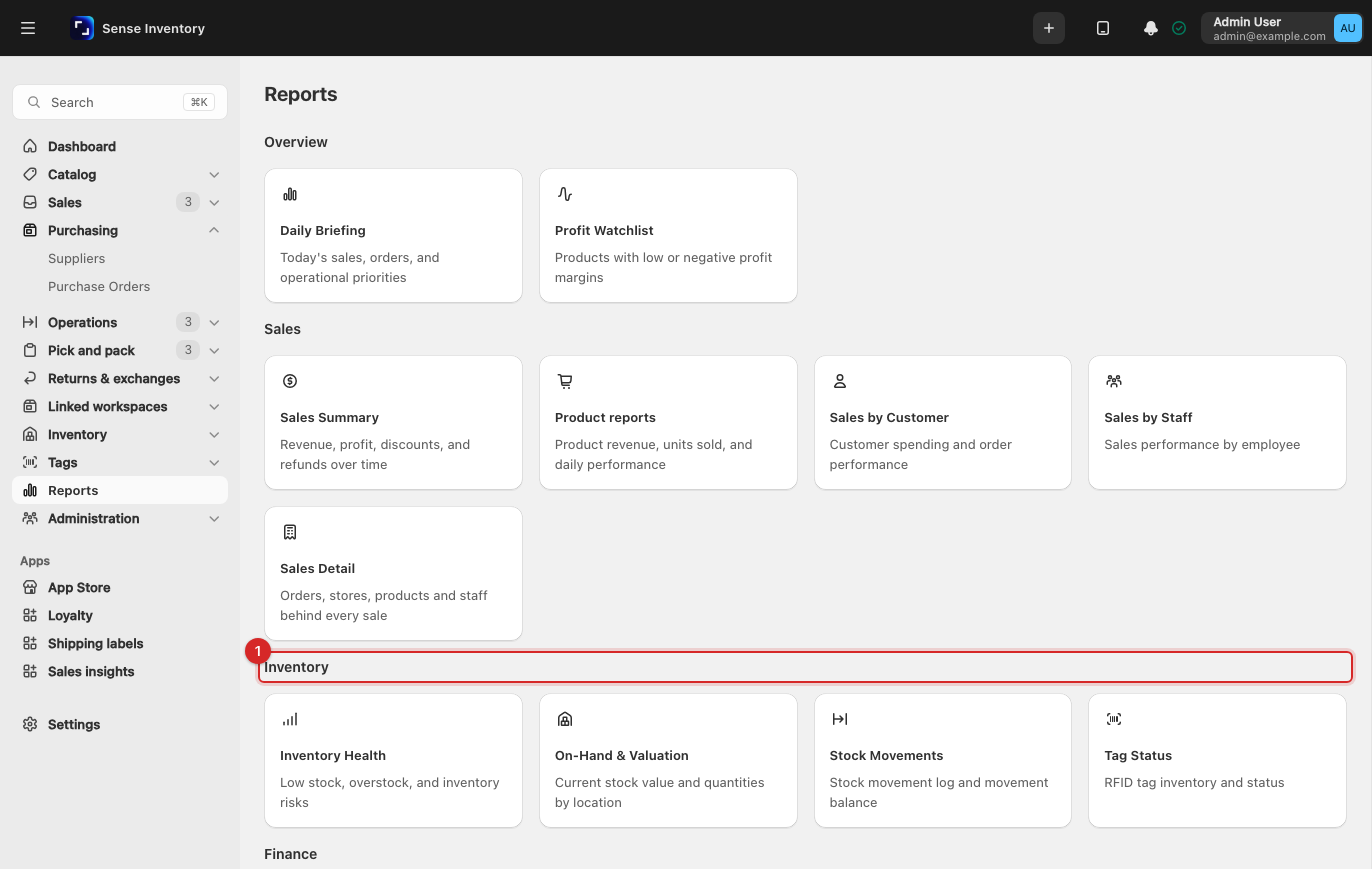
| You are asking | Open |
|---|---|
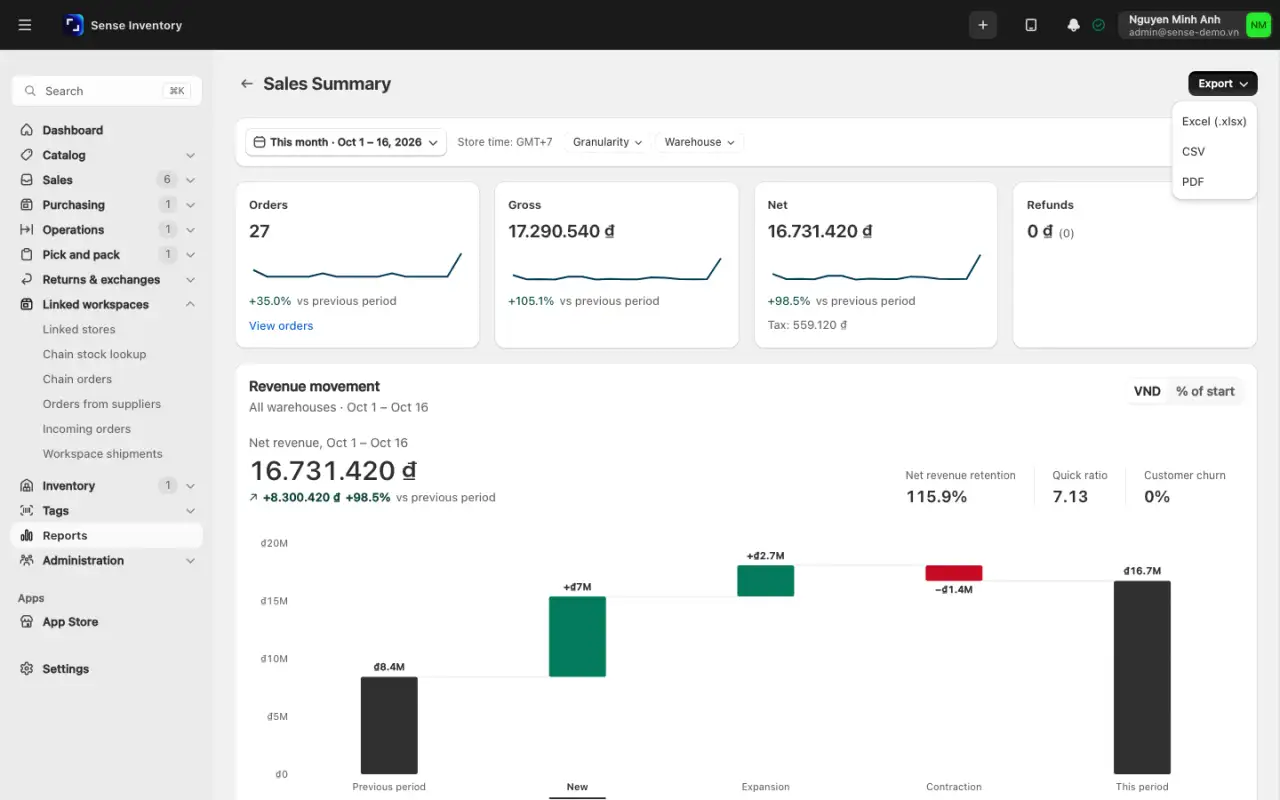
| How much revenue this period | Sales Summary |
| Which products sell best | Product reports → Revenue |
| Which customers buy the most | Sales by Customer |
| Which staff sell well | Sales by Staff |
| Which products lose money or run on thin margins | Profit Watchlist |
| Which products move and which sit still | Product reports → Performance |
| Yesterday's sales by store and salesperson | Sales Detail |
| What is overstocked, running out, or in excess | Inventory Health |
| How much stock is left and what it is worth | On-Hand & Valuation |
| Why a stock number changed | Stock Movements |
| Whether the stock number matches the ledger | Stock Movements → Movement balance |
| What state RFID tags are in | Tag Status |
| Who owes money and for how long | Debt reports → Debt Summary, Debt reports → Debt Aging |
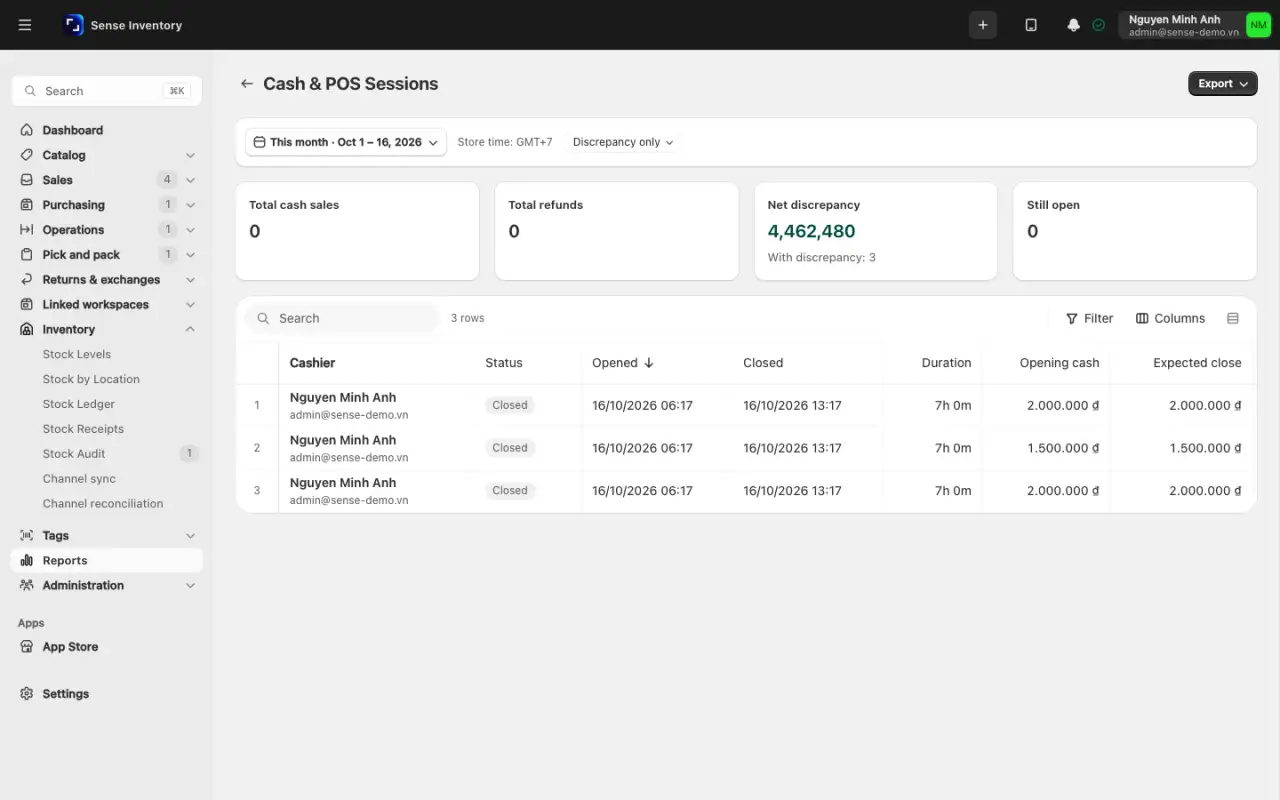
| Whether a cashier shift has a cash gap | Cash & POS Sessions |
| Whether vouchers actually drive sales | Voucher Performance |
| How consignment stock sold and what is owed to the consignor | Consignment reconciliation |
| Which e-invoices need attention and how much output VAT | E-invoices by order, VAT from e-invoices |
The Movement balance tab is the one to remember: it takes opening stock, adds receipts, subtracts issues, and lands on closing stock per SKU. When you need to prove the ledger adds up, open this tab.
The three shared controls
Nearly every report carries the same controls at the top:
- Period: pick Today, Yesterday, Last 7 days, Last 30 days, This month, Last month or Custom range. Reports do not share one default period (most open on this month, Sales Detail opens on yesterday), so before comparing two reports, put both on the same period first. A start date after the end date is not an error: the report simply returns no rows.
- Warehouse: all warehouses or one; a parent warehouse includes its children. An account restricted by warehouse silently sees only its own, so two people can open the same report and see different totals with neither being wrong. Picking a warehouse outside your access shows "You do not have access to this warehouse".
- Export: click Export and choose Excel (.xlsx), CSV or PDF. The file uses the filters you set, always fetches fresh data, and carries a header with the period plus a block listing the filters and the row count. You need the export permission on top of the view permission. Every export is recorded in the Activity Log. Each server builds one file at a time, so a large export can make the next one wait.
Report results are cached for 30 seconds, so they can trail a transaction you just made by a few seconds. A list that is too long is cut off and shows "Showing the first {count} of {total} rows. Narrow the filters or export for the full list."
When two numbers disagree
Work through this order and stop at the step that finds it:
- Compare period and warehouse between the two screens. Most cases end right here.
- If a profit figure looks wrong, check the Cost price of the products involved.
- If a stock figure looks wrong, open Stock Movements → Movement balance and narrow it to that SKU: the report points at the entry that breaks the expected balance. To read individual entries, continue in the stock ledger.
- If the number disagrees with a sales channel, open Inventory → Channel sync (Inventory & Audit → Channel sync on the classic layout) and clear the Unlinked products view first. Details in Process channel orders.
- If the number disagrees with what is on the shelf, run a stock count.
Common tasks
Find what needs restocking
Go to Reports → Inventory Health and pick a Warehouse.
Adjust Cover threshold (days) and Velocity window (days) if needed. The defaults are 14 and 30 days.
Open the Low stock tab and read Reorder qty: enough stock for the cover days, and never below the minimum.
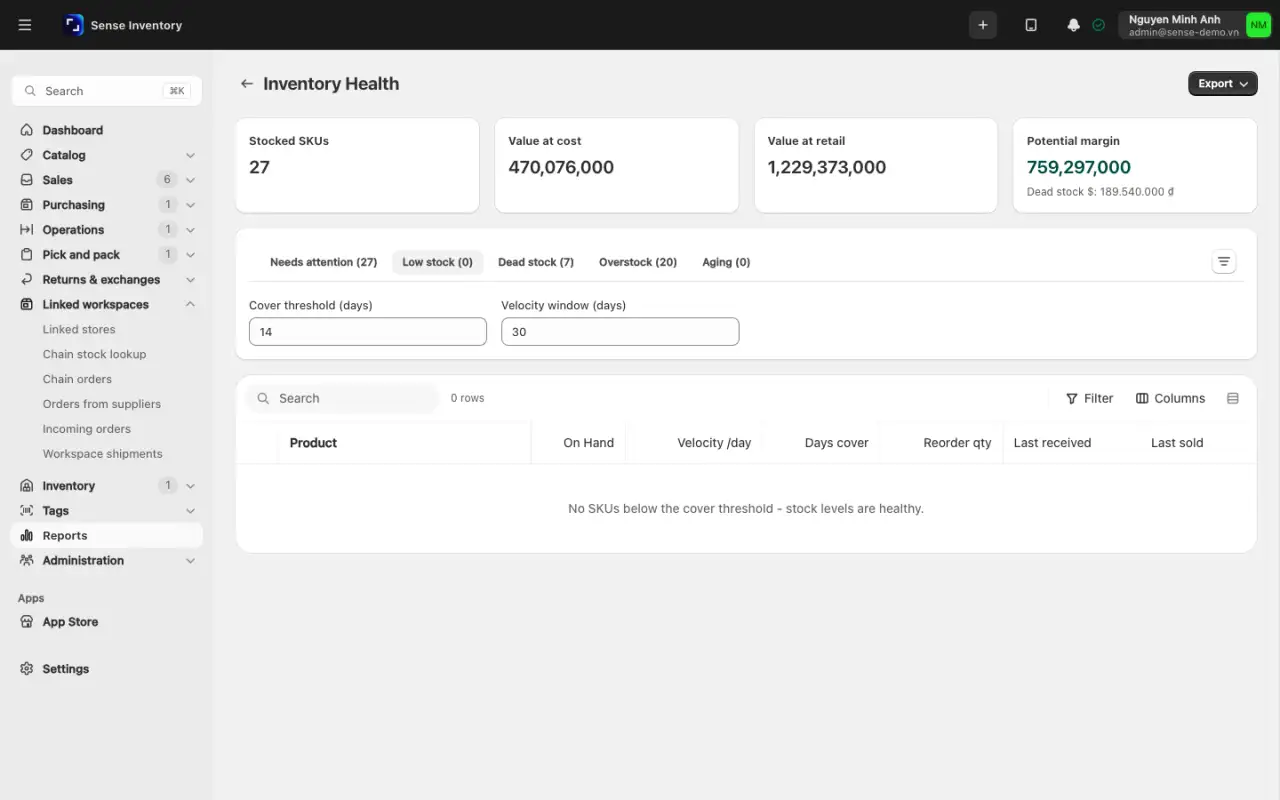
Click Export and choose Excel (.xlsx) to send the list to purchasing.
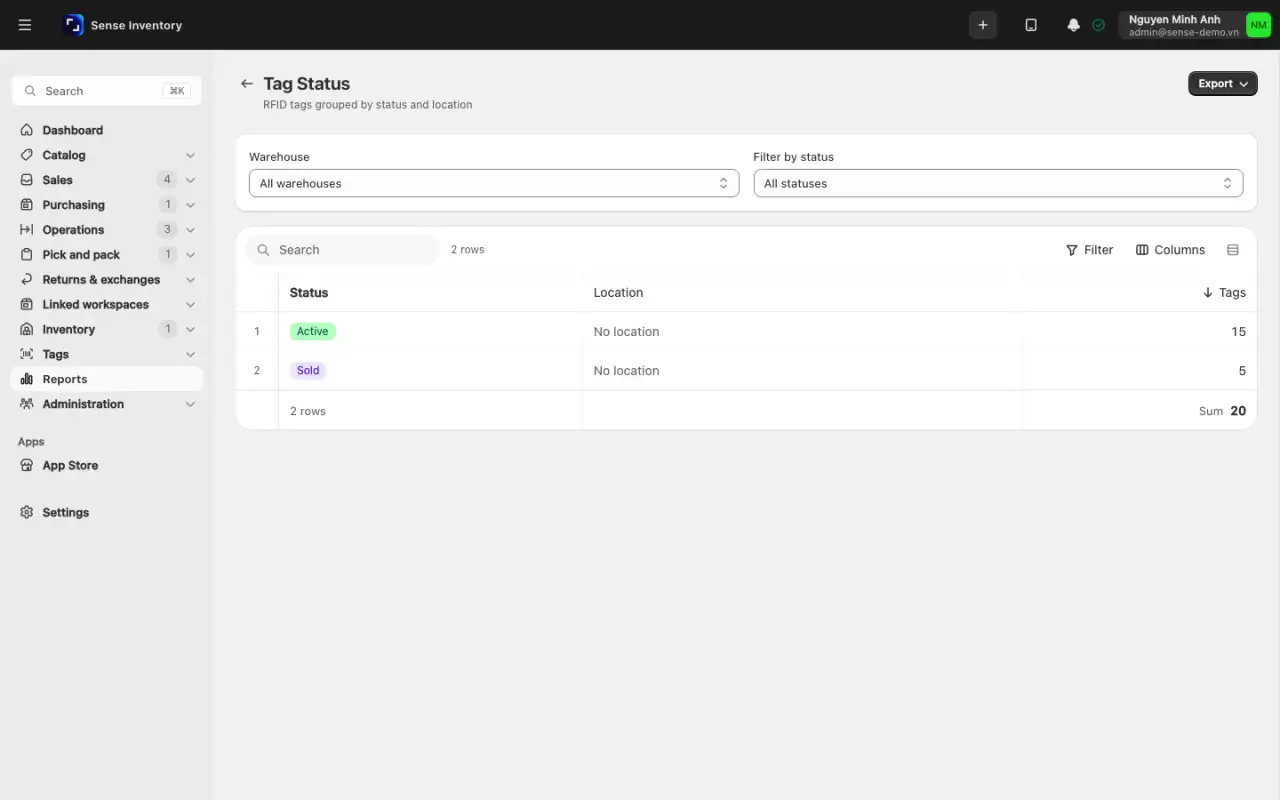
Check RFID tags by status
Open Reports and, under Inventory, click Tag Status.
Pick a Warehouse and, if you like, a Status.
Read the number of tags per status and location, then click Export if you want a file.
Export sales for the accountant
Open Sales Summary.
Click the date button and choose Last month (or Custom range).
Set Granularity to Month and pick a Warehouse.
Click Export and choose Excel (.xlsx), CSV or PDF. The button shows "Exporting…" while it works and "Export failed" if it fails.
Review cash differences at the till
Open Cash & POS Sessions and set the date range.
Tick Discrepancy only.
Compare expected and actual cash, then click Export if you need a file. This report has no warehouse filter: each session counts under the warehouse of its most recent order.
See who sold what yesterday
Open Sales Detail. It opens on yesterday.
Filter by Store or Salesperson, or search by order number, product, SKU, customer or phone.
Choose Group by Store or Salesperson.
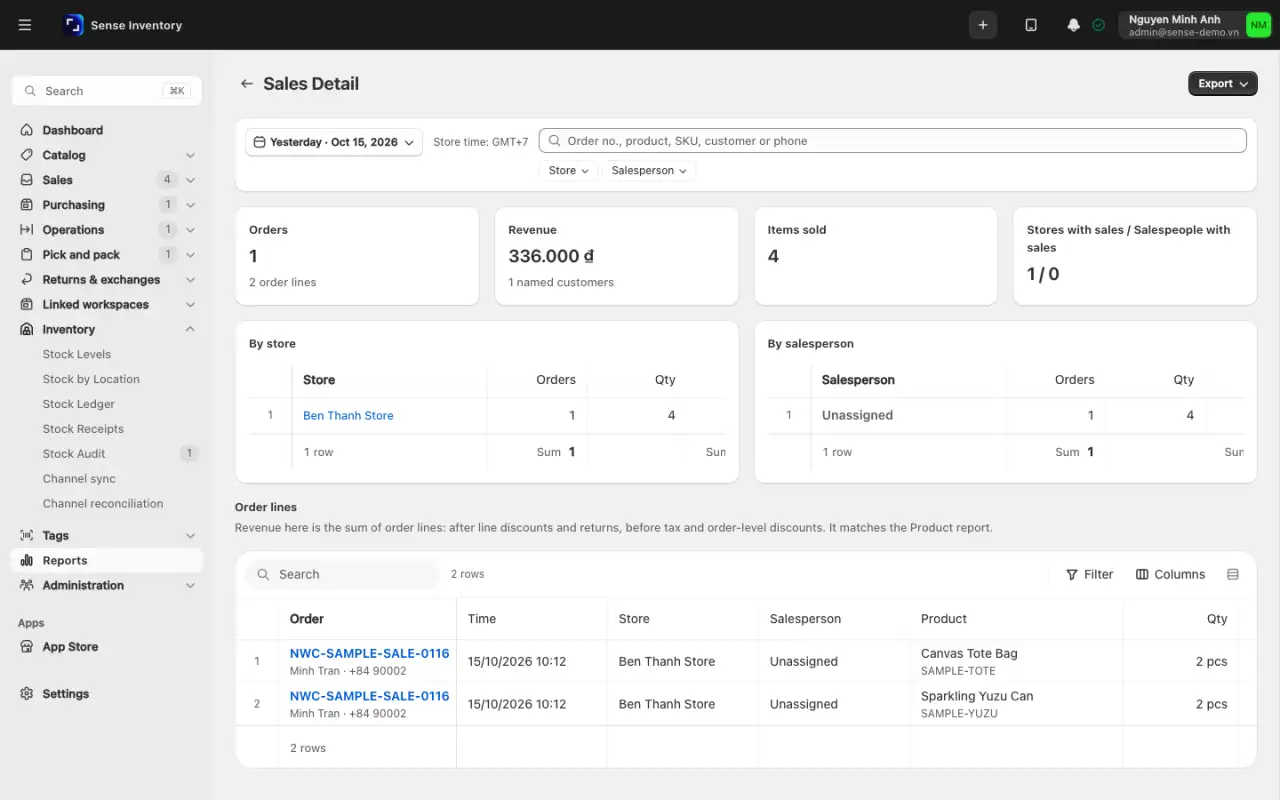
Click Export. The file has two extra sheets, By Store and By Staff.
End of day
- Match revenue against order counts and each payment method.
- Open Cash & POS Sessions: look for cash gaps, unusual refunds, and cancellations.
- Skim Stock Movements for odd swings or large adjustments.
- If debt tracking is on, check Debt reports → Debt Aging for amounts falling due.
- Anything that needs action gets an owner and a deadline today, not tomorrow.
Operational guidance
Low-stock, slow-mover, and thin-margin warnings are signals to investigate, not conclusions. Check the underlying transactions and the business context before reordering, discounting, or adjusting stock.
When something looks wrong
| Symptom | Likely cause | What to do |
|---|---|---|
| Two reports show different totals | Different period or warehouse | Recheck the two selectors at the top of each report |
| Profit and margin show 0 | Products missing cost price | Enter a Cost price |
| Revenue unusually high | Sample data still present (NWC-SAMPLE-) | Delete it under Settings → Sample Data |
| End-of-day numbers land on the wrong day | Wrong timezone | Fix it under Settings → General Settings |
| Report stock differs from physical stock | Transfers or submitted documents still pending | Complete the pending documents, see Issue, transfer, and adjust |
| A report group is missing | Account lacks that view permission | Request access, see Users and security |
| An export is missing data | Filters narrowed the result | Remove filters and export again |
| No Export button | The account lacks the export permission | Ask for the export permission through a role |
| "The date range is not valid" | A day that does not exist (such as 30 February), or Movement balance with a missing date or an end before the start | Pick a valid range |
| "You do not have access to this warehouse" | A warehouse outside your assignment | Pick one of yours, or ask an admin to assign it |
| "Could not load this report" | Lost connection | Check the network and click Retry |
| A second export is slow | Each server builds one export at a time | Wait for the first file |
| You see less stock than a colleague | Account restricted by warehouse | Check the warehouses assigned on the user profile |
Two counting rules that raise questions: sales reports count only completed Sale orders, so draft and cancelled orders never appear, and refunds are netted against revenue rather than removed from it.
The mobile app has 20 reports. It has no Sales Detail, Tag Status or e-invoice reports, and Daily Briefing, Inventory Health and Debt Summary cannot be exported there.
Read next
- Count and reconcile inventory: when system stock disagrees with the shelf.
- Issue, transfer, and adjust stock: read the ledger entry by entry.
- Debt and consignment: act on the debts you see in reports.